- Our Story
- Publications & Resources
- Publications & Resources
- Publications
- IEEE Signal Processing Magazine
- IEEE Journal of Selected Topics in Signal Processing
- IEEE Signal Processing Letters
- IEEE Transactions on Computational Imaging
- IEEE Transactions on Image Processing
- IEEE Transactions on Information Forensics and Security
- IEEE Transactions on Multimedia
- IEEE Transactions on Signal and Information Processing over Networks
- IEEE Transactions on Signal Processing
- IEEE TCI
- IEEE TSIPN
- Data & Challenges
- Submit Manuscript
- Guidelines
- Information for Authors
- Special Issue Deadlines
- Overview Articles
- Top Accessed Articles
- SPS Newsletter
- SigPort
- SPS Resource Center
- Publications FAQ
- Blog
- News
- Dataset Papers
- Conferences & Events
- Community & Involvement
- Professional Development
- For Volunteers
- Information for Authors-OJSP
-
Home
Conferences Events IEEE Signal Processing Magazine IEEE SPL Article IEEE TIFS Article IEEE TMM Article IEEE TSP Article Jobs in Signal Processing Lectures Machine Learning Seasonal Schools Signal Processing News SPM Article SPS Distinguished Lectures SPS Newsletter Article SPS Webinar SPS Webinars SPS Webinar Series Webinar webinars
-
Our Story
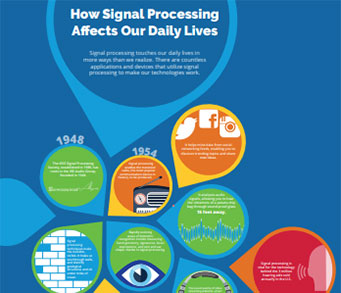
What is Signal Processing?

The technology we use, and even rely on, in our everyday lives –computers, radios, video, cell phones – is enabled by signal processing. Learn More » -
Publications & Resources
-
SPS Resources
- Signal Processing Magazine The premier publication of the society.
- SPS Newsletter Monthly updates in Signal Processing
- SPS Resource Center Online library of tutorials, lectures, and presentations.
- SigPort Online repository for reports, papers, and more.
- SPS Feed The latest news, events, and more from the world of Signal Processing.
-
SPS Resources
-
Conferences & Events
-
Community & Involvement
-
Membership
- Join SPS The IEEE Signal Processing Magazine, Conference, Discounts, Awards, Collaborations, and more!
- Chapter Locator Find your local chapter and connect with fellow industry professionals, academics and students
- Women in Signal Processing Networking and engagement opportunities for women across signal processing disciplines
- Students Scholarships, conference discounts, travel grants, SP Cup, VIP Cup, 5-MICC
- Young Professionals Career development opportunities, networking
- Get Involved
-
Technical Committees
- Applied Signal Processing Systems
- Audio and Acoustic Signal Processing
- Bio Imaging and Signal Processing
- Computational Imaging
- Image Video and Multidimensional Signal Processing
- Information Forensics and Security
- Machine Learning for Signal Processing
- Multimedia Signal Processing
- Sensor Array and Multichannel
- Signal Processing for Communication and Networking
- Signal Processing Theory and Methods
- Speech and Language Processing
- Technical Working Groups
- More TC Resources
-
Membership
-
Professional Development
-
Professional Development
- Signal Processing Mentorship Academy (SigMA) Program
- Micro Mentoring Experience Program (MiME)
- Distinguished Lecturer Program
- Distinguished Lecturers
- Distinguished Lecturer Nominations
- Past Lecturers
- Distinguished Industry Speaker Program
- Distinguished Industry Speakers
- Distinguished Industry Speaker Nominations
- Industry Resources
- IEEE Training Materials
- Jobs in Signal Processing: IEEE Job Site
-
Career Resources
- SPS Education Program Educational content in signal processing and related fields.
- Distinguished Lecturer Program Chapters have access to educators and authors in the fields of Signal Processing
- Job Opportunities Signal Processing and Technical Committee specific job opportunities
- Job Submission Form Employers may submit opportunities in the area of Signal Processing.
-
Professional Development
-
For Volunteers
-
For Board & Committee Members
- Board Agenda/Minutes* Agendas, minutes and supporting documentation for Board and Committee Members
- SPS Directory* Directory of volunteers, society and division directory for Board and Committee Members.
- Membership Development Reports* Insight into the Society’s month-over-month and year-over-year growths and declines for Board and Committee Members
-
For Board & Committee Members
Popular Pages
Today's:
- Information for Authors
- (ICME 2026) 2026 IEEE International Conference on Multimedia and Expo
- IEEE Transactions on Information Forensics and Security
- IEEE Transactions on Image Processing
- IEEE Transactions on Multimedia
- Submit a Manuscript
- IEEE Journal of Selected Topics in Signal Processing
- (CAI 2026) IEEE Conference on Artificial Intelligence 2026
- IEEE Signal Processing Letters
- Conference Call for Papers
- (ICIP 2026) 2026 IEEE International Conference on Image Processing
- IEEE Transactions on Audio, Speech and Language Processing
- Unified EDICS
- (ISBI 2026) 2026 IEEE 23rd International Symposium on Biomedical Imaging
- Access Restricted
All time:
- Information for Authors
- Submit a Manuscript
- IEEE Transactions on Image Processing
- IEEE Transactions on Information Forensics and Security
- IEEE Transactions on Multimedia
- IEEE Transactions on Audio, Speech and Language Processing
- IEEE Signal Processing Letters
- IEEE Transactions on Signal Processing
- Conferences & Events
- IEEE Journal of Selected Topics in Signal Processing
- Information for Authors-SPL
- Conference Call for Papers
- Signal Processing 101
- IEEE Signal Processing Magazine
- Guidelines
Last viewed:
- Submit a Manuscript
- A Fixed-Time Convergent Distributed Algorithm for Time-Varying Optimal Resource Allocation Problem
- Information for Authors
- Call for Mentors: 2025 IEEE SPS SigMA Program - Signal Processing Mentorship Academy
- Membership
- Member Discounts: International life insurance
- Information for Authors-SPM
- (ICASSP 2025) 2025 IEEE International Conference on Acoustics, Speech and Signal Processing
- Signal Processing Mentorship Academy (SigMA) Program
- IEEE Transactions on Audio, Speech and Language Processing
- (ASRU 2025) 2025 IEEE Automatic Speech Recognition and Understanding Workshop
- SPS Scholarship Program
- Editorial Board
- Access Restricted
- IEEE Signal Processing Letters
Assessment of the Effectiveness of Seven Biometric Feature Normalization Techniques
You are here
Transactions on Information Forensics and Security
Publications & Resources
For Authors
Top Reasons to Join SPS Today!
1. IEEE Signal Processing Magazine
2. Signal Processing Digital Library*
3. Inside Signal Processing Newsletter
4. SPS Resource Center
5. Career advancement & recognition
6. Discounts on conferences and publications
7. Professional networking
8. Communities for students, young professionals, and women
9. Volunteer opportunities
10. Coming soon! PDH/CEU credits
Click here to learn more.
Assessment of the Effectiveness of Seven Biometric Feature Normalization Techniques
The importance of normalizing biometric features or matching scores is understood in the multimodal biometric case, but there is less attention to the unimodal case. Prior reports assess the effectiveness of normalization directly on biometric performance. We propose that this process is logically comprised of two independent steps: (1) methods to equalize the effect of each biometric feature on the similarity scores calculated from all the features together and (2) methods of weighting the normalized features to optimize biometric performance. In this report, we address step 1 only and focus exclusively on normally distributed features. We show how differences in the variance of features lead to differences in the strength of the influence of each feature on the similarity scores produced from all the features. Since these differences in variance have nothing to do with importance in the biometric sense, it makes no sense to allow them to have greater weight in the assessment of biometric performance. We employed two types of features: (1) real eye-movement features and (2) synthetic features. We compare six variance normalization methods (histogram equalization, L1-normalization, median normalization, z-score normalization, min–max normalization, and L-infinite normalization) and one distance metric (Mahalanobis distance) in terms of how well they reduce the impact of the variance differences. The effectiveness of different techniques on real data depended on the strength of the inter-correlation of the features. For weakly correlated real features and synthetic features, histogram equalization was the best method followed by L1 normalization.
SPS Social Media
- IEEE SPS Facebook Page https://www.facebook.com/ieeeSPS
- IEEE SPS X Page https://x.com/IEEEsps
- IEEE SPS Instagram Page https://www.instagram.com/ieeesps/?hl=en
- IEEE SPS LinkedIn Page https://www.linkedin.com/company/ieeesps/
- IEEE SPS YouTube Channel https://www.youtube.com/ieeeSPS
Home | Sitemap | Contact | Accessibility | Nondiscrimination Policy | IEEE Ethics Reporting | IEEE Privacy Policy | Terms | Feedback
© Copyright 2025 IEEE - All rights reserved. Use of this website signifies your agreement to the IEEE Terms and Conditions.
A public charity, IEEE is the world's largest technical professional organization dedicated to advancing technology for the benefit of humanity.


